


The TC Quantamental Rating, a new proprietary analytic offered by Trading Central analyses a company's financial attractiveness through a combination of quantitative and fundamental factors. The analytic presents a consistent framework for rating over 50,000 stocks worldwide on a scale of 1-10, with one representing the most bearish and ten, the most bullish. Spectrum Markets spoke to Senior Quantitative Analyst, Raymond Yung, CFA, to find out how the analytic was developed.
Spectrum Markets provides a safe, accessible marketplace where members and their retail clients can make investment decisions with the knowledge, transparency and information they need.
What is the thinking behind the development of Quantamental Rating?
We believe transparency and openness is a critical component to providing premium investment research. The merit of fundamental analysis on equity valuation has a long history and has given rise to the development of fundamental factor investing in the financial industry, with well-known examples such as the Fama French Model in 1992.
What factors shaped the design of the analytic?
We investigated and analyzed the collective “wisdom” from academics and practitioners and concluded that the application of quantitative methods on fundamental data, partnered with technical factors, yields promising results. TC Quantamental Rating represents our first major step in bringing this pairing to reality.
So, in practice, how does this benefit the investor?
The robust analytical structure of TC Quantamental Rating offers an objective and independent perspective when assessing the financial attractiveness of companies in the equity markets. It presents a consistent and standardized framework for the evaluation of companies within an investment universe such as an index, industry, country or region.
A Quantamental Rating is assigned to each company as an indication of its attractiveness in terms of investment. The rating ranges from 1 to 10 with 1 being the most bearish and 10 representing the most bullish rating.
Can you explain how the Quantamental Rating is calculated?
TC Quantamental Rating is an aggregation of ratings from five different factor groups namely Value, Growth, Quality, Income and Momentum. These are chosen with the aim of capturing a broad range of known fundamental and technical indicators associated with their respective investment styles.
So, it’s all down to just those five factors?
It’s a lot more nuanced than that! We consider 20 individual factors within those five factor groups. For example, in determining the Momentum factor group we separately consider three-month and 12-month risk-adjusted price momentum. Meanwhile, in calculating the Quality factor group, we consider operating margin, return on equity, ROE change, return on invested capital, ROIC change, change in shares outstanding and total debt/equity ratio change.
Furthermore, the factors we consider are slightly different when looking at the financial services sector, reflecting the very different capital structure of this sector compared to others.
And the big question; what are the results like?
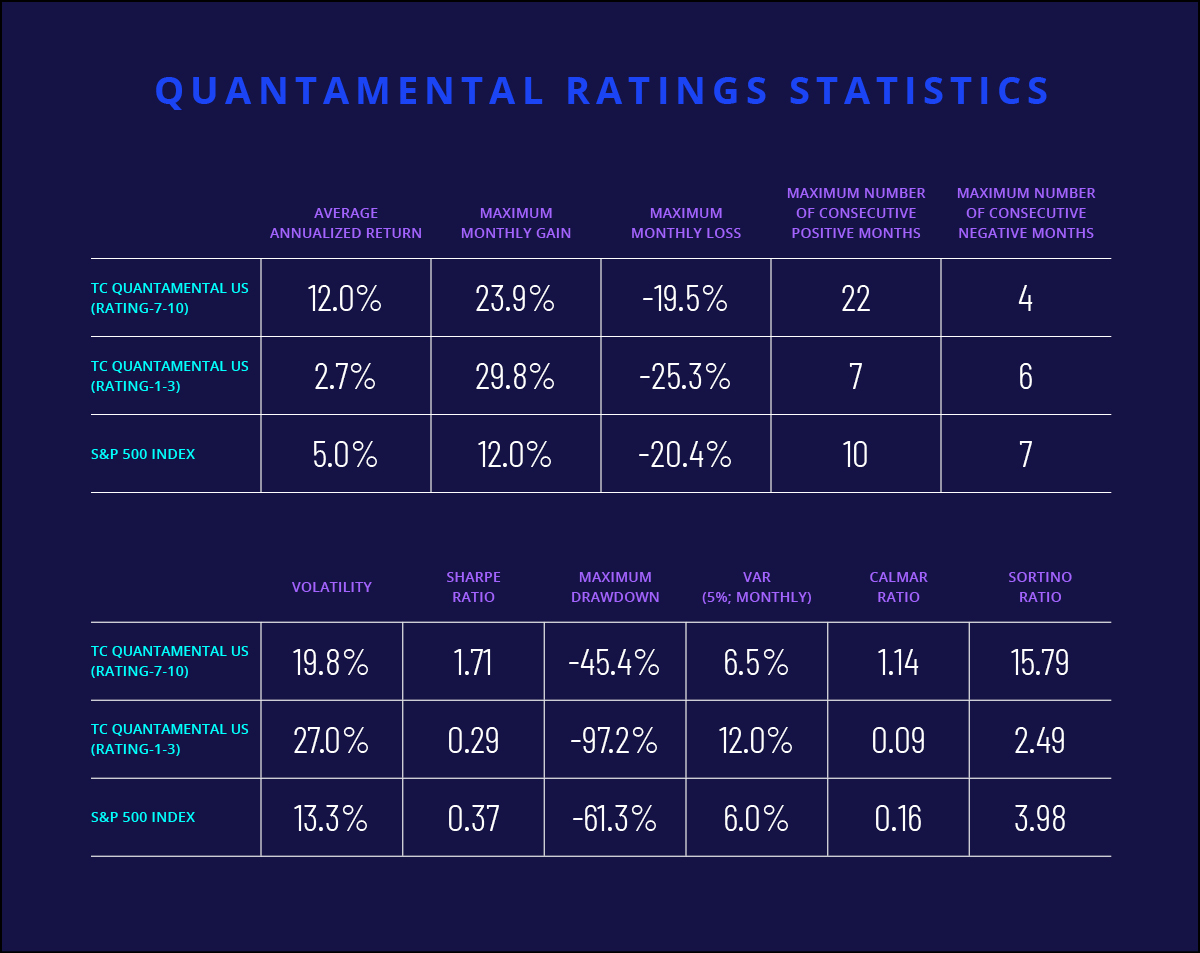
To verify the validity and the added value of TC Quantamental Ratings, we performed in-depth backtesting analysis looking at more than 4,000 US stocks over a period of 15 years from February 2006 to March 2021.
We calculated monthly returns from the next month’s stock returns (1 month from month-end update of rating) without accounting for any transaction costs. Cumulative returns were computed assuming the stocks within the specified rating groups were bought at the end of each month and held for the subsequent month. This process was performed throughout the entire period of backtesting and the total sum of all the monthly returns of each rating group is its cumulative return.
We split the stocks into two groups; the Rating 7-10 group includes stronger companies - representing approximately 6% of the total stock “universe” in the backtesting - while the Rating 1-3 group includes weaker companies - representing approximately 10% of the total stock “universe” in the backtesting.
We found that the cumulative return of Rating Group 7-10 is consistently higher than that of S&P 500 while the Rating Group 1-3 underperforms S&P 500 over the past 15 years. This clearly demonstrates the strength of the method through which Quantamental Ratings are derived.


.jpg)

.png)

